With the OpenStreetMap extension, you can create OpenStreetMap mashups easily. You can generate a report object with an OpenStreetMap with markers placed on the map. The marker's speech bubble can contain your own data. Placement of the pins can be done by using location data (latitude & longitude) or simply pass the address on as a location.
OpenStreetMap can use different tile servers on top of the data. You can use them as an alternative for OpenStreetMap's own tiles.
myDBR uses Leaflet JavaScript library as API to OpenStreetMap. For heatmaps, myDBR uses a Leaflet plugin Leaflet heat.
Map markers can be customized with Leaflet custom icons and Leaflet.ExtraMarkers
Commands
dbr.openstreetmap - Show mapdbr.openstreetmap.options - Additional options to the Leaflet.js L.Mapdbr.openstreetmap.heatmap - Use heat layerdbr.openstreetmap.tiles - Use alternative tiles on top of a mapdbr.openstreetmap.geojson - Include GeoJSON-file into the mapsdbr.openstreetmap.polygon - Add polygons to the map
Syntax
select 'dbr.openstreetmap', 'coordinates' | 'address' | 'coordinates_address' | osm_node {,title, width, height, zoom}
select 'dbr.openstreetmap.options', 'options'
select 'dbr.openstreetmap.heatmap', 1[, leafletheat_options]
select 'dbr.openstreetmap.tiles', tile_server_url [, tiles_options]
select 'dbr.openstreetmap.geojson', url_to_geojson_file [, geojson_options]
select 'dbr.openstreetmap.polygon', LatLng_array [, polyline_options]
Using the address bubble:
select address, bubble_html
Using latitude/longitude bubble:
select latitude, longitude, [bubble_html [, '{bubble_options}']]
Using OSM nodes:
select node_id, [bubble_html [, '{bubble_options}']]
Using coordinates_address bubble:
select latitude, longitude, address, [bubble_html [, '{bubble_options}']]
Using latitude/longitude-based heatmap:
select latitude, longitude [, PointWeight] }
Using address-based heatmap:
select address [, PointWeight]
Where:
- Leafletheat_options
- Optional options for Leaflet heat like "{radius: 25}"
Property Description minOpacity the minimum opacity the heat will start at maxZoom zoom level where the points reach maximum intensity (as intensity scales with zoom), equals maxZoom of the map by default max maximum point intensity, 1.0 by default radius radius of each "point" of the heatmap, 25 by default blur amount of blur, 15 by default gradient color gradient config, e.g. {0.4: 'blue', 0.65: 'lime', 1: 'red'} - tiles_options
- Optional options required by the used tiles server
- PointWeight
- The PointWeight object allows you to additionally specify a weight for that data point. Applying a weight to a data point will cause the PointWeight to be rendered with greater intensity. The default weight is 1
- bubble_options
-
Bubble options are the options defined in Leaflet custom icons and Leaflet.ExtraMarkers
Property Description Default Value Possible values extraClasses Additional classes in the created <i>tag''fa-rotate90 myclass;space delimited classes to addicon Name of the icon with prefix ''fa-coffee(see icon library's documentation)iconColor Color of the icon 'white''white','black'or css code (hex, rgba etc)innerHTML Custom HTML code ''<svg>, images, or other HTML; a truthy assignment will override the default html icon creation behaviormarkerColor Color of the marker (css class) 'blue''blue','red','orange-dark','orange','yellow','blue-dark','cyan','purple','violet','pink','green-dark','green','green-light','black', or'white'number Instead of an icon, define a plain text '''1'or'A', must set icon:'fa-number'prefix The icon library's base class 'glyphicon''fa'(see icon library's documentation)shape Shape of the marker (css class) 'circle''circle','square','star', or'penta'
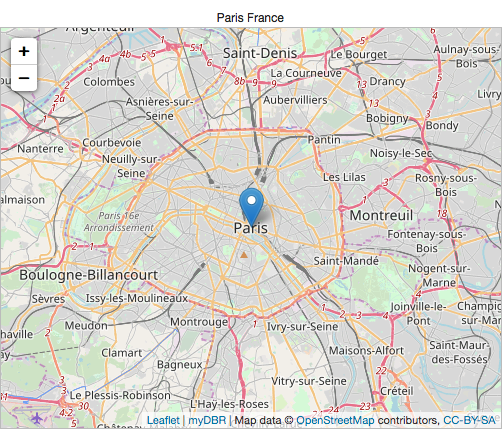
Sample map with address
/* Mashup based on address */
select 'dbr.openstreetmap', 'address';

select 'Paris', 'Paris, France';
/* Map based on address */
select 'dbr.openstreetmap', 'address';

select 'Paris', 'Paris, France';
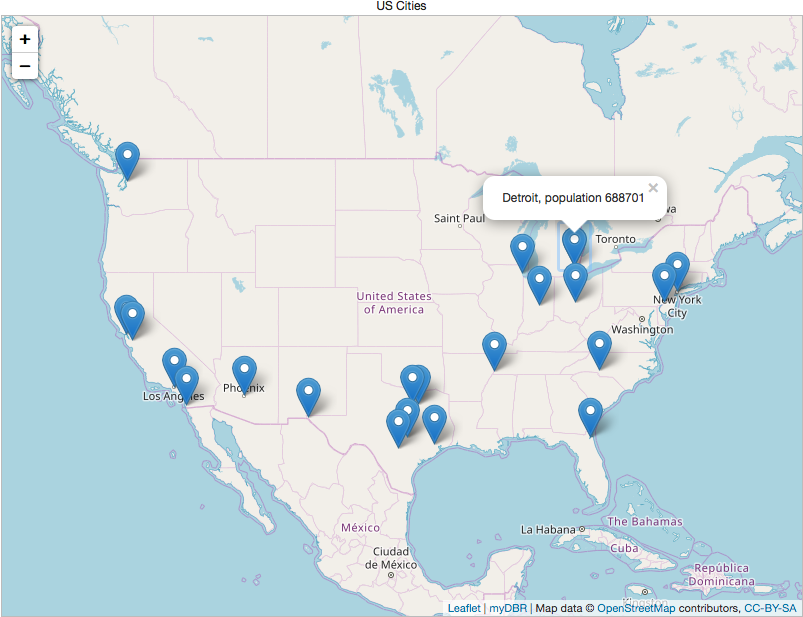
/* Map based on coordinates */
select 'dbr.openstreetmap', 'coordinates';

select latitude, longitude, bubble_html
from mydb.cities;
You can mix latitude and longitude or with address. If the latitude is null, myDBR will use the address.
select 'dbr.openstreetmap', 'coordinates_address';

select null, null, 'Chicago', 'City of Chicago'
union
select 40.7127837,-74.0059413, null,  "New York";
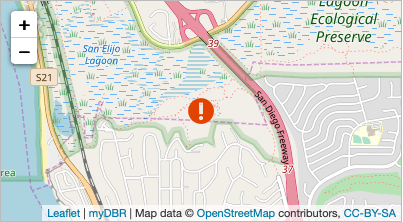
By using 'iconUrl'-attribute, myDBR will use the bubble_options as Leaflet-icon attributes. See Leaflet documentation for Markers With Custom Icons.
select 'dbr.openstreetmap', 'coordinates', '', 400, 220, 14;

select 33.005, -117.265, '', "{iconUrl: 'user/images/warning.gif', iconSize: [32, 32]}";
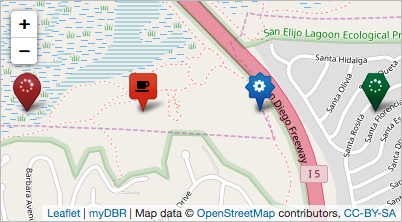
Adding FontAwsome icons (included in myDBR) into the markers
select 'dbr.openstreetmap', 'coordinates', '', 400, 220;

select 33.005, -117.270, '', "{icon: 'fa-spinner',shape: 'circle',markerColor: 'red',prefix: 'fa',extraClasses: 'fa-spin'}"
union
select 33.005, -117.265, '', "{icon: 'fa-coffee',shape: 'square',markerColor: 'orange-dark',prefix: 'fa',iconColor: 'black'}"
union
select 33.005, -117.260, '', "{icon: 'fa-cog',shape: 'star',prefix: 'fa',markerColor: 'blue',iconColor: 'white'}"
union
select 33.005, -117.255, '', "{icon: 'fa-spinner',shape: 'penta',markerColor: 'green-dark',iconColor: 'white', prefix: 'fa'}"
;
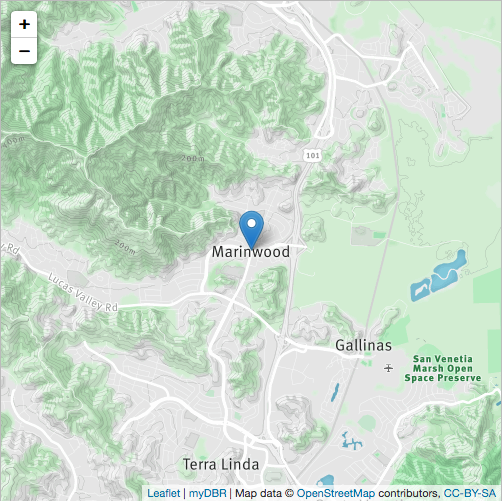
With OpenStreetMap, you can use different tile layers in the map. In the example, we'll use MapBox's tile layer. To use the tile layers, you pass the URL to the tile layer with the dbr.openstreetmap.tiles command with optional options. In the example, we'll choose run-bike-hike-layer by passing the "id:'mapbox.run-bike-hike'" option to MapBox.
select 'dbr.openstreetmap', 'address', 'Marinwood run-bike-hike tile', 500, 500, 13;
select 'dbr.openstreetmap.tiles', 'https://api.tiles.mapbox.com/v4/{id}/{z}/{x}/{y}.png?access_token=pk.eyJ1IjoibWFwYm94IiwiYSI6ImNpejY4NXVycTA2emYycXBndHRqcmZ3N3gifQ.rJcFIG214AriISLbB6B5aw',
  "id:'mapbox.run-bike-hike'";

select 'Marinwood', 'Marinwood';
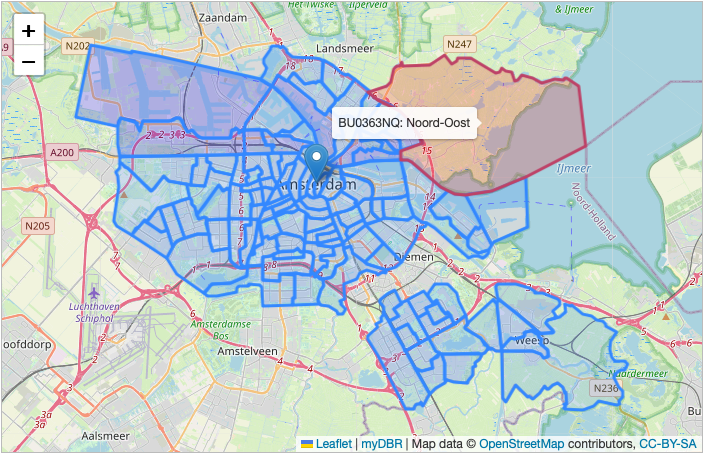
You can also extend the map by including GeoJSON files to the map. Geojson options can be added for more functionality.
In the example we'll utilize the onEachFeature-functionality, which invokes the function for each geojson-feature (in this case the official neighborhoods of Amsterdam). We'll attach actions for mouse hovering and create a linked report to each feature. The feature.properties are part of the included geojson file.
create procedure sp_DBR_amsterdam()
begin

select 'dbr.javascript', 'function onEachFeature(feature, layer) {
layer.bindTooltip(feature.properties.CBS_Wijkcode+": "+feature.properties.Gebied).openTooltip();

layer.on("mouseover", function () {
  this.setStyle({
    "fillColor": "#ff0000",
    "color" : "#BD4267"
  });
});
layer.on("mouseout", function () {
  this.setStyle({
    "fillColor": "#0000ff",
    "color" : "#3388ff"
  });
});
layer.on("click", function () {
  // Open report in a poup. Get the generic JS call and pass the Gebied to it
  // remove the preceding "javascript:" and add the CBS_Wijkcode as parameter
  // You can use browser debugger to see what is going on
  var url=$(".mapurl").attr("href").substr(11).replace("&e1=1", "&u1="+feature.properties.CBS_Wijkcode);
  eval(url);
});

}';

select 'dbr.openstreetmap', 'address', 'Amsterdam', 700, 450;
select 'dbr.openstreetmap.geojson', 'internal/amsterdam_wijk_lng_lat.json', '{onEachFeature:onEachFeature}';

select 'Amsterdam';

/* Generate an URL for the report link */
select 'dbr.report', 'sp_DBR_amsterdam_wijkcode', 'popup', 'inWijkcode<=1';
select 'dbr.button', '', 'hidden mapurl';

select 1;

end
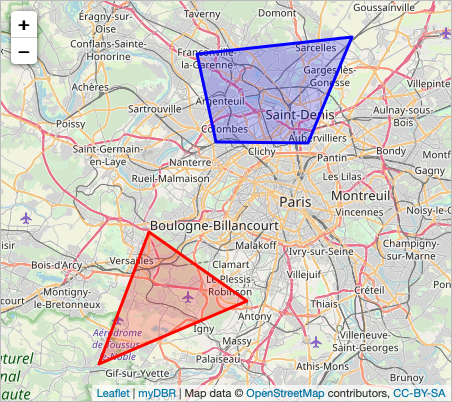
Polygons are added on top of the existing map (coordinates/heatmap). If your map contains only polygons, use an empty result set for coordinates.
select 'dbr.openstreetmap.polygon', latlngs, options
from (
select '[[48.829469, 2.150573],[48.767051, 2.285156], [48.709994, 2.081909]]' as latlngs, "{color: 'red'}" as options
union
select "[[48.990130, 2.216491],[49.005447, 2.429351],[48.909864, 2.368927],[48.910767, 2.242584]]", "{color: 'blue'}"
) as q;

select 'dbr.openstreetmap', 'coordinates','', 900, 500;

select 0, 0 limit 0;
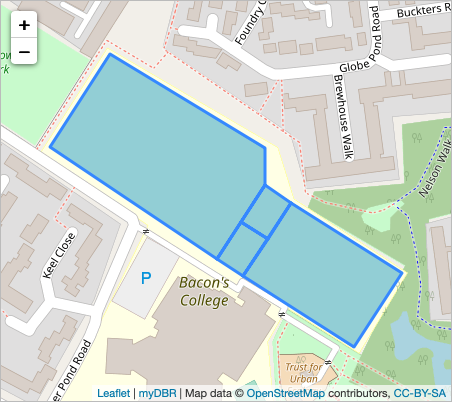
The polygons can also contain multiple areas combined as one object:
select 'dbr.openstreetmap.polygon',  '
[
  [
    [51.504465, -0.042298],
    [51.503831, -0.04063],
    [51.50359, -0.04063],
    [51.503096, -0.041145],
    [51.503844, -0.042942]
  ],
  [
    [51.50359, -0.04063],
    [51.503470, -0.040346],
    [51.503226, -0.040598],
    [51.50334, -0.040890]
  ],
  [
    [51.50334, -0.040890],
    [51.503226, -0.040598],
    [51.502979, -0.040862],
    [51.503096, -0.041145]
  ],
  [
    [51.503470, -0.040346],
    [51.502999, -0.03916],
    [51.502502, -0.039675],
    [51.502979, -0.040862]
  ]
]
';

select 'dbr.openstreetmap', 'coordinates','', 450, 400;

select 0, 0 limit 0;