The eChart extension is provided as a skeleton extension to enable the use of extra charts in ChartDirector. It implements a Bubble and a Radar chart as an example. Full source code is included. The eChart extension is placed in the user-directory, and therefore any modifications made to it will be retained in the myDBR update.
Commands
dbr.echart - Create an extended chartdbr.echart.color - Select colors for the chartdbr.echart.name - Select category namesdbr.echart.bubble_scale - Scale bubble chart axis
Syntax
select 'dbr.echart', 'radar' | 'bubble'
select 'dbr.echart.color', 'ARGB color1', 'ARGB color2'...
select 'dbr.echart.color', 'Category 1', 'Category 2'...
select 'dbr.echart.bubble_scale',1
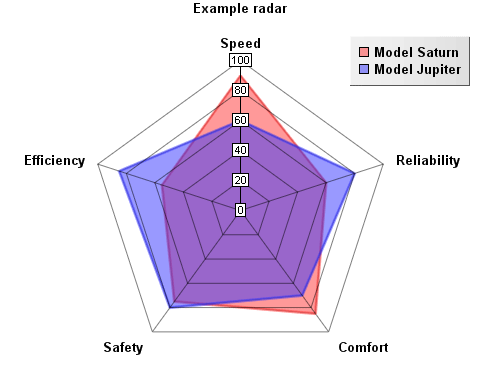
select 'dbr.echart', 'radar', 'Example radar';
select 'dbr.echart.color', '0x80ff3333', '0x803333ff';
select 'dbr.echart.name', 'Model Saturn', 'Model Jupiter';

select Speed, Reliability, Comfort, Safety, Efficiency
from radar_data;
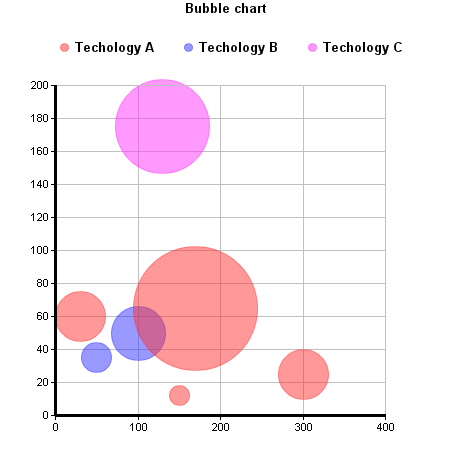
Since the axis will be automatically scaled and can contain different data types, the bubble size (z) is by default in pixels.
If you want to use absolute sizes for bubble size, use the select 'dbr.echart.bubble_scale',1 command to scale the axis.
After this, the bubble size is relative to the axis.
select 'dbr.echart', 'bubble', 'Bubble chart';
select 'dbr.echart.color', '0x80ff3333', '0x803333ff','0x80FF33ff';

select x, y, z, category
from bubble_data;